What Is Nominal Data? | Examples & Definition
Nominal data is a type of qualitative data that is characterized by its categorical nature. It is often used to describe characteristics or attributes of individuals, objects, or events, and it is typically represented as a label or category.
Nominal labels or categories don’t have an inherent rank or numerical value, which means you can’t logically order them. Researchers often use this type of data in conjunction with other types of quantitative data to provide a more complete understanding of a research question or problem.
- Religion (e.g., Christian, Muslim, Hindu, Buddhist, Jewish)
- Gender (e.g., male, female, nonbinary)
- Country of origin (e.g., Netherlands, China, Russia, Peru)
- Colors (e.g., red, green, blue, purple, yellow)
- Vehicle types (e.g., bus, truck, car, motorcycle)
The data for each of these variables can be categorized with labels, but there’s no inherent order to them. For instance, the labels for gender could be ranked in any random order.
What is nominal data?
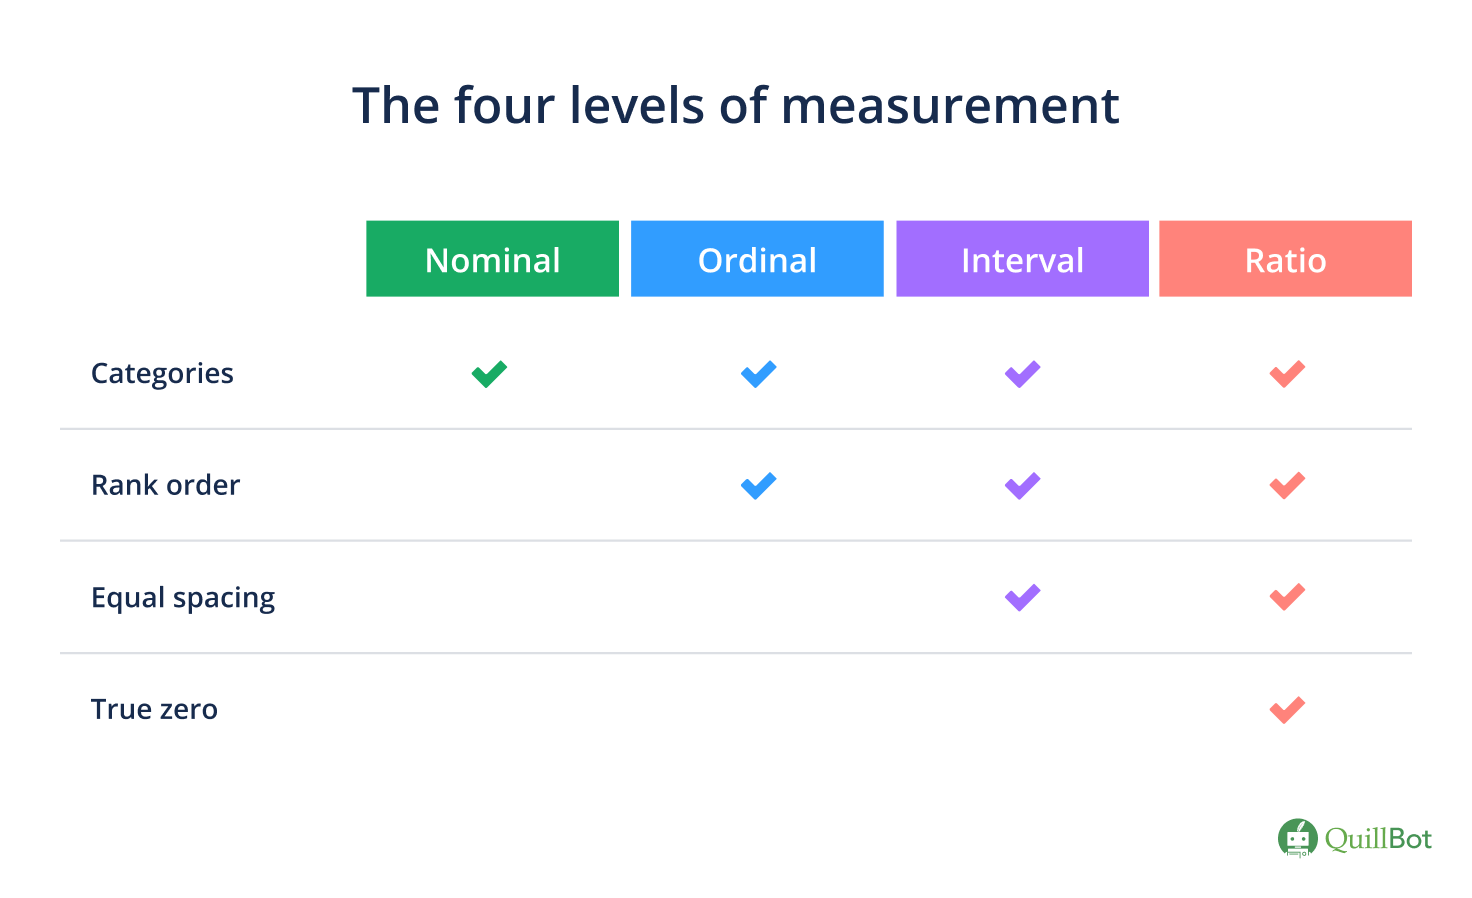
In statistics, there are four levels of measurement: nominal, ordinal, interval, and ratio. Nominal is the first level of measurement. Like ordinal variables, nominal variables are categorical (instead of quantitative) in nature.
Nominal data is similar to ordinal data because they can both be categorized with labels, but the nominal labels can’t be ranked in a logical order.
Nominal data examples
Nominal data is often expressed in words, but sometimes numerical labels are used. However, these numerical labels can still not be ranked in a logical or meaningful way. You also can’t perform arithmetic operations with the data.
Nominal variables are often used in social science research that studies the effects of gender, religious background, or ethnicity. Each data point (e.g., response, observation) fits into exactly one category.
| Nominal variable | Nominal levels |
|---|---|
| Gender |
|
| Weather conditions |
|
| Sports |
|
| Cuisines |
|
| Social media platforms |
|
Nominal vs ordinal data
Nominal data and ordinal data are similar because they’re both types of categorical data. However, ordinal data has an inherent order or ranking, whereas nominal data doesn’t. This means that you can’t rank nominal labels in a meaningful way.
Nominal data is typically used when you want to categorize data, but you don’t need to make comparisons or rank the data. This type of data is often used to provide descriptive statistics about the demographic characteristics of a population or sample (e.g., calculating the frequency of each gender category in a dataset).
An example of nominal data is marital status. You could use the following labels for this variable:
- Married
- Divorced
- Single
- Widowed
There’s no logical order to the ranking, which makes this a nominal variable. You could rank the labels in any order.
Ordinal data
An example of ordinal data is level of education. You could use the following categories for this variable:
- High school degree
- Associate degree
- Bachelor’s degree
- Master’s degree
- Doctoral degree
There’s a logical order to the ranking, which makes this an ordinal variable. You could start with the lowest or highest degree, but it would be odd to start with one of the middle categories.
How to collect nominal data
Nominal data is typically collected with open-ended or closed-ended survey questions.
- You use closed-ended questions if the variable of interest has only a few possible categories to cover all the data.
| Question | Answer options |
|---|---|
| Where do you prefer to work out? |
|
| Do you have a sports membership? |
|
| What is your favorite sport? |
|
- You use open-ended questions if your variable has many possible categories or if you’re unable to create an exhaustive list of labels.
- What is your place of residence?
- What is your employee ID?
- What is your zip code?
How to analyze nominal data
You can use your nominal data to create tables or charts. This will help you collect descriptive statistics about the dataset, which can tell you something about the central tendency and variability of your data.
Since nominal is the lowest level of measurement with the lowest precision, you’re not able to calculate most measures of central tendency or variability for it.
| Male | Female | Female |
| Male | Female | Male |
| Female | Male | Male |
| Nonbinary | Female | Female |
| Male | Male | Nonbinary |
| Female | Female | Female |
| Male | Nonbinary | Nonbinary |
| Female | Female | Male |
| Male | Male | Female |
Distribution
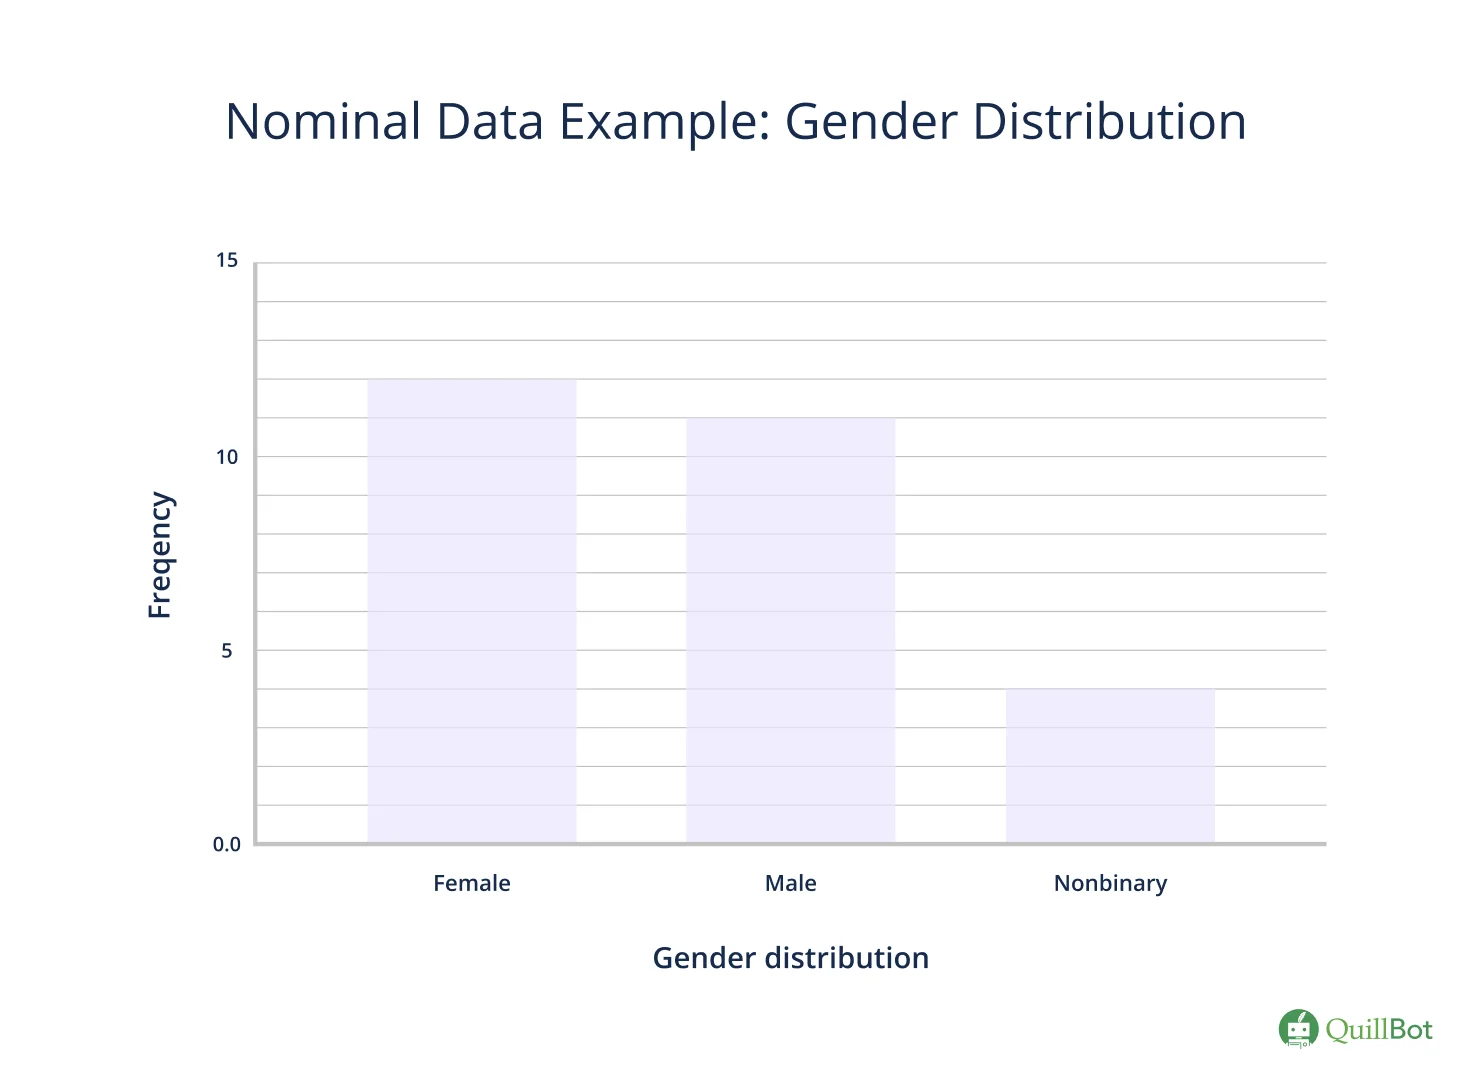
You can organize the dataset by creating a frequency distribution table that shows you the number of responses for each gender label.
| Gender | Frequency |
|---|---|
| Female | 12 |
| Male | 11 |
| Nonbinary | 4 |
It’s also an option to convert the frequencies to percentages. You divide each frequency by the total number of values in the dataset (27) and multiply that by 100.
| Gender | Frequency |
|---|---|
| Female | 44.4% |
| Male | 40.7% |
| Nonbinary | 14.8% |
The simple frequency distribution table can be converted into a bar graph, where the categories are plotted on the horizontal axis and the frequencies on the vertical axis. The order of the categories doesn’t matter since there’s no inherent order to them.
The percentage frequency distribution can be converted into a pie chart, where each slice of pie corresponds to the percentage of a particular category in the dataset.
Central tendency
The central tendency of your dataset is the point where most of your values lie. Three common measures of central tendency are the mode, mean, and median. The mode (aka the most frequently recurring value) is the only applicable measure for nominal data due to the categorical nature and low precision of this type of data.
You’d have to use arithmetic operations (e.g., addition, division) to calculate the mean. This is not possible for this qualitative type of data. To find the median, your values need to be ordered from low to high, which is not possible for nominal labels.
The highest number of people in your research identify as female, so that’s the mode.
Statistical tests for nominal data
You can test hypotheses about your data with the help of inferential statistics.
Parametric tests can’t be used with nominal data because this type of data violates some of the assumptions (e.g., a normal distribution). This means you’ll always have to use a nonparametric statistical test to analyze nominal data.
Nominal data is typically analyzed using a chi-square test. There are two types that apply to nominal data:
Chi-square goodness of fit
You use the chi-square goodness of fit test when your dataset has only one variable and you’ve collected data from just one population with a probability sampling method, such as simple random sampling, stratified sampling, or cluster sampling.
The test shows you whether the frequency distribution of your random sample corresponds with your expectations of the population as a whole. It helps you determine how representative your sample is of the population.
The chi-square goodness of fit test statistic provides information on how different your observation is from the expectation based on chance. A test statistic of zero shows that there’s no difference between your observation and your expectation.
Chi-square test of independence
The chi-square test of independence allows you to test if a relationship between two categorical variables is statistically significant.
The test helps you determine whether two nominal variables from the same sample are independent of each other.
Frequently asked questions about nominal data
- Can you use nominal data in an ANOVA test?
-
You can’t use an ANOVA test if the nominal data is your dependent variable. The dependent variable needs to be continuous (interval or ratio data).
The independent variable for an ANOVA should be categorical (either nominal or ordinal data).
- Are data at the nominal level of measurement quantitative or qualitative?
-
Data at the nominal level of measurement is qualitative.
Nominal data is used to identify or classify individuals, objects, or phenomena into distinct categories or groups, but it does not have any inherent numerical value or order.
You can use numerical labels to replace textual labels (e.g., 1 = male, 2 = female, 3 = nonbinary), but these numerical labels are random and are not meaningful. You could rank the labels in any order (e.g., 1 = female, 2 = nonbinary, 3 = male). This means you can’t use these numerical labels for calculations.
- Does nominal data involve the use of variables that have been rank ordered?
-
No, nominal data can only be assigned to categories that have no inherent order to them.
Categorical data with categories that can be ordered in a meaningful way is called ordinal data.
- What type of information does data at the nominal level describe?
-
Data at the nominal level of measurement typically describes categorical or qualitative descriptive information, such as gender, religion, or ethnicity.
Contrary to ordinal data, nominal data doesn’t have an inherent order to it, so you can’t rank the categories in a meaningful order.
- What is the difference between nominal and ordinal data?
-
Nominal data and ordinal data are similar because they can both be grouped into categories. However, ordinal data can be ranked in a logical order (e.g., low, medium high), whereas nominal data can’t (e.g., male, female, nonbinary).
Cite this Quillbot article
We encourage the use of reliable sources in all types of writing. You can copy and paste the citation or click the "Cite this article" button to automatically add it to our free Citation Generator.
Merkus, J. (2025, November 26). What Is Nominal Data? | Examples & Definition. Quillbot. Retrieved February 2, 2026, from https://quillbot.com/blog/research/nominal-data/


