What Is Ordinal Data? | Examples & Definition
Ordinal data is categorized into ranks, with each category having a natural order. However, the spacing between these categories is not clearly uniform or quantifiable.
For instance, consider the variable “college degree,” which can be categorized into the following levels:
- Associate degree
- Bachelor’s degree
- Master’s degree
- Doctoral degree
While there is a clear hierarchical structure to these categories, we can’t claim that the difference between “associate degree” and “bachelor’s degree” is the exact same as the difference between “master’s degree” and “doctoral degree.” This lack of precise measurement makes this scale ordinal in nature.
What is ordinal data?
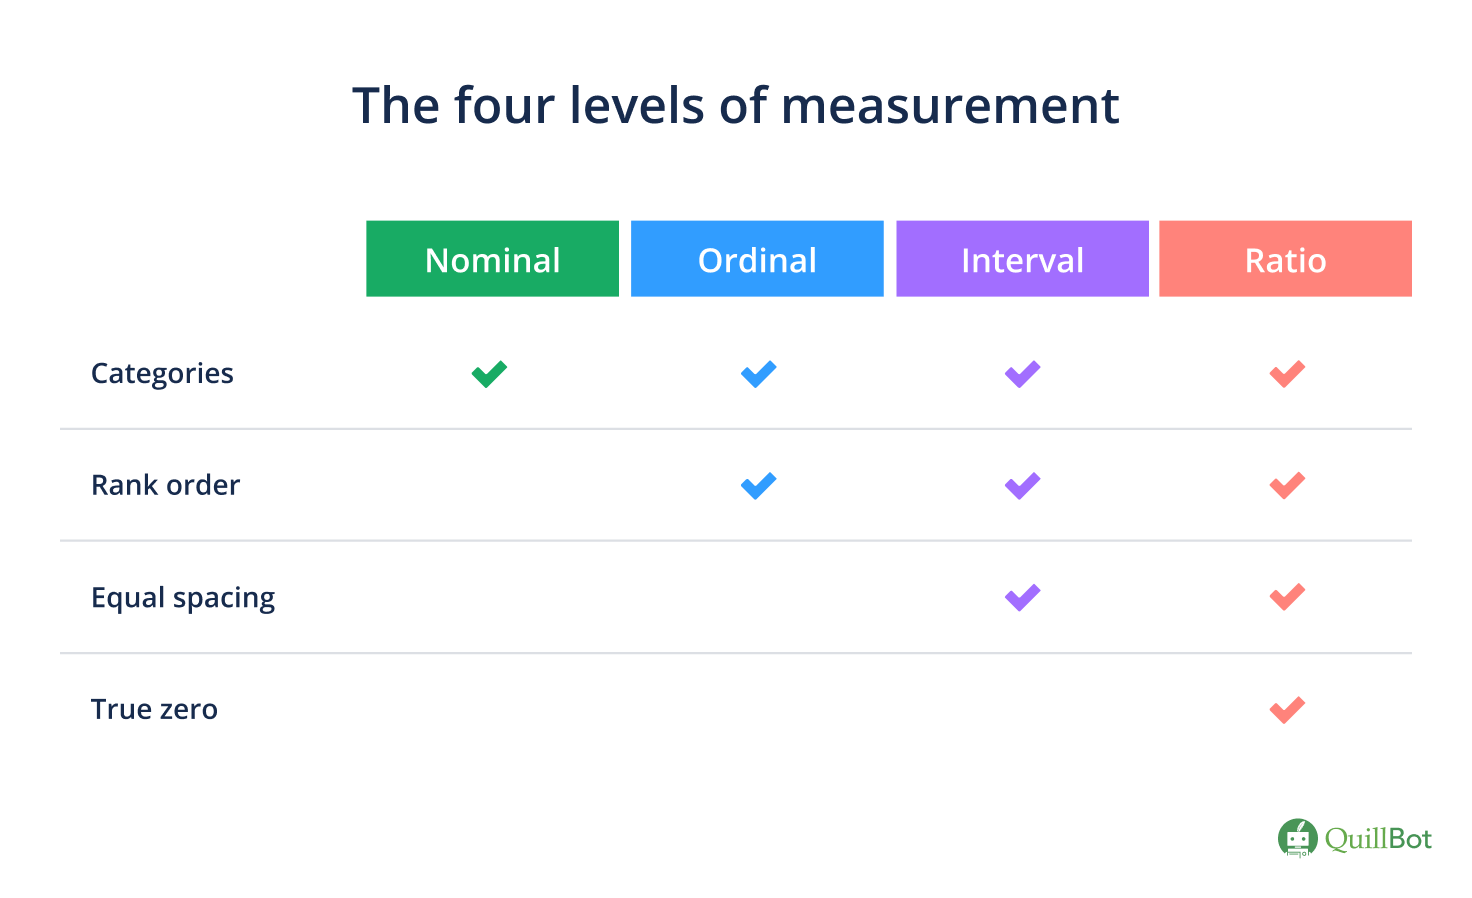
There are four levels of measurement: nominal, ordinal, interval, and ratio. Ordinal is the second level of measurement. Like nominal variables, ordinal variables are categorical (as opposed to quantitative) in nature.
Nominal data is similar to ordinal data because they both use categories, but the nominal categories can’t be ranked in a logical order. Interval data is also similar to ordinal data, but with interval data, each category is an equal distance from the next category.
Ordinal data examples
In social science research, ordinal data frequently contains subjective assessments, such as ratings and opinions, as well as demographic information that can be grouped into levels (e.g., age or socioeconomic status).
| Ordinal variable | Ordinal levels |
|---|---|
| Job satisfaction rating |
|
| Grades |
|
| Income |
|
| Frequency of zoo visits |
|
| Sleep quality |
|
Nominal vs ordinal data
Nominal data and ordinal data are both types of categorical data, but nominal data has no inherent order or ranking, whereas ordinal data does.
- The values in nominal data are merely labels or categories and there’s no inherent significance to the order or relationship between them. Nominal data is often used in situations where you want to categorize or group data, but you don’t need to make comparisons or rank the data (e.g., categorizing by ethnicity).
- The values in ordinal data have a natural order or sequence and there’s a meaningful difference between the values (although it’s not possible to quantify this difference). Ordinal data is often used in situations where you want to measure the relative opinion or intensity of something, such as customer satisfaction, without needing an exact numerical value.
An example of nominal data is religion. You could use the following labels for this variable:
- Christian
- Muslim
- Jewish
- Hindu
- Buddhist
This is a nominal variable because there’s no logical order to the ranking. You could rank them in any order.
Ordinal data
An example of ordinal data is product satisfaction. You could use the following labels for this variable:
- Very dissatisfied
- Somewhat dissatisfied
- Neutral
- Somewhat satisfied
- Very satisfied
This is an ordinal variable because there is a logical order to the ranking. You either start with the most negative or the most positive label.
How to collect ordinal data
Ordinal data is usually collected through surveys with multiple-choice questions. They are typically easy and quick to fill out.
| Question | Answer options |
|---|---|
| What is your level of education? |
|
| How often do you go to the gym? |
|
| How satisfied are you with the gym’s facilities? |
|
Some variables can be measured on multiple levels. One of these variables is “age.”
- If you ask participants for their exact age, the data is ratio level.
- If you ask participants to select the bracket that contains their age (e.g., 18–25), the data is ordinal level.
If the research design allows for it, it’s best to use the more precise level (ratio) because most calculations and statistical analyses require a high level of measurement (interval or ratio data).
Collecting ordinal data using Likert scales
Likert scales are a popular tool to collect ordinal data. Likert scales consist of at least four Likert-type questions. Participants can choose from a continuum of response items.
| Strongly disagree | Disagree | Neutral | Agree | Strongly agree |
The values have an inherent order to them, so researchers often use numerical values to replace the labels (e.g., dissatisfied = 1, neutral = 2, satisfied = 3). However, you can’t be sure that the difference between dissatisfied and neutral is equal to the distance between neutral and satisfied.
You can’t meaningfully perform addition, subtraction, or multiplication with the values, which means you can’t perform most mathematical calculations to collect descriptive statistics.
How to analyze ordinal data
Ordinal data can be analyzed with descriptive and inferential statistics.
Descriptive statistics
You can obtain the following descriptive statistics for ordinal data:
- the frequency distribution (numbers, percentages)
- the mode or median (measures of central tendency)
- the range (measure of variability)
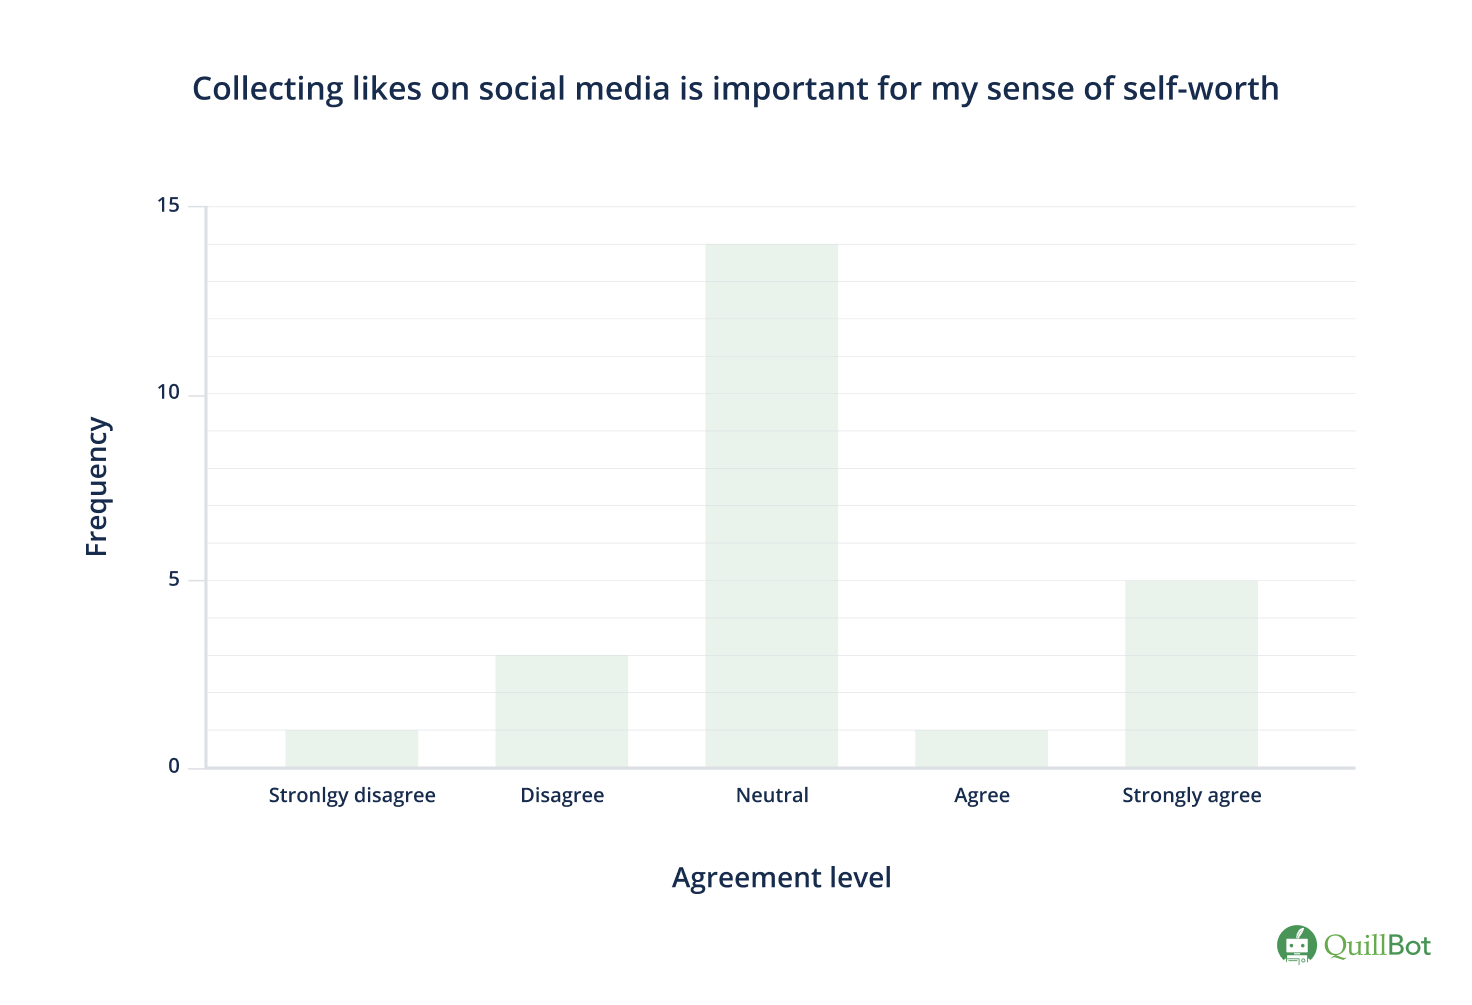
- Collecting likes on social media is important for my sense of self-worth.
You can create an overview of your data with a frequency distribution table that shows you how many times an answer option was selected.
| Answer option | Frequency |
|---|---|
| Strongly disagree | 1 |
| Disagree | 3 |
| Neutral | 14 |
| Agree | 1 |
| Strongly agree | 5 |
You can turn your frequency table into a bar graph to visualize the data. Your categories are plotted on the x-axis (in the right order) and the frequencies on the y-axis.
- The mean can never be calculated for ordinal data because you need to use arithmetic operations such as addition and division. This isn’t possible for ordinal data due to the unknown differences between adjacent scores.
- The mode is the value with the highest frequency and can almost always be found for ordinal data. In our example, the value with the highest frequency is “neutral.”
- The median is the middle value of your data set when the data is ranked. It can be found in some cases.
- In an odd-numbered data set, you’ll always be able to find the median because there’s only one middle value.
- In an even-numbered data set, you won’t always be able to find the median because it is the average of the two middle values. If both middle values are the same (e.g., disagree and disagree), the median can be found. If the middle values differ (e.g., disagree and neutral), you can’t find the median. In our example, the two middle values are both “neutral,” so the median is “neutral.”
In some non-academic contexts, researchers do report a mean (e.g., the mean customer satisfaction score), but it should be avoided in academic contexts.
| Strongly disagree | 1 |
| Disagree | 2 |
| Neutral | 3 |
| Agree | 4 |
| Strongly agree | 5 |
- The minimum value is the lowest value in your dataset (in this case, 1).
- The maximum value is the highest value in your dataset (in this case, 5).
- The range is the difference between the highest and lowest value (5 – 1 = 4).
The range provides you with information on how much your scores differ. In this case, there was at least one answer on both ends of the scale.
Statistical tests for ordinal data
You can test your hypotheses with the help of inferential statistics. You can use nonparametric tests for ordinal data because they focus on rankings without the need for more precise measurements.
Ordinal data doesn’t meet the criteria for parametric tests (e.g., normally distributed data, the option to calculate the mean).
The best option for a statistical test depends on the level of measurement, your research goals, and the characteristics of your sample.
| Test | Goal | Samples or variables | Example |
|---|---|---|---|
| Kruskal-Wallis H test | Compare mean rankings | At least 3 samples | How does perceived intelligence differ between young adults, adults, and elderly people? |
| Mann-Whitney U test (Wilcoxon rank sum test) | Compare sum of rankings | 2 independent samples | How does perceived intelligence in one town differ from that in another? |
| Mood’s median test | Compare medians | At least 2 samples | How different are the median reading levels of children in 2 neighboring school districts? |
| Spearman’s rho or rank correlation coefficient | Correlate 2 variables | 2 ordinal variables | Does the level of education correlate with perceived intelligence? |
| Wilcoxon matched-pairs signed-rank test | Compare magnitude and direction of difference between distributions of scores | 2 dependent samples | How similar are the distributions of educational levels of men and women in the same city? |
Frequently asked questions about ordinal data
- Is ordinal data qualitative or quantitative?
-
Ordinal data is usually considered qualitative in nature. The data can be numerical, but the differences between categories are not equal or meaningful. This means you can’t use them to calculate measures of central tendency (e.g., mean) or variability (e.g., standard deviation).
- Is age ordinal data?
-
The variable age can be measured at the ordinal or ratio level.
- If you ask participants to provide you with their exact age (e.g., 28), the data is ratio level.
- If you ask participants to select the bracket that contains their age (e.g., 26–35), the data is ordinal.
Ordinal data and ratio data are similar because they can both be ranked in a logical order. However, for ratio data, the differences between adjacent scores are equal and there’s a true, meaningful zero.
- What is the difference between nominal and ordinal data?
-
Nominal data and ordinal data are similar because they can both be grouped into categories. However, ordinal data can be ranked in a logical order (e.g., low, medium high), whereas nominal data can’t (e.g., male, female, nonbinary).
- What are properties of ordinal data?
-
Ordinal is the second level of measurement. It has two main properties:
- Ordinal data can be grouped into categories
- Ordinal data can be ranked in a logical order (e.g., low, medium, high)
- What is the difference between ordinal and interval data?
-
Ordinal data and interval data are similar because they can both be ranked in a logical order. However, for interval data, the differences between adjacent scores are equal.
Cite this Quillbot article
We encourage the use of reliable sources in all types of writing. You can copy and paste the citation or click the "Cite this article" button to automatically add it to our free Citation Generator.
Merkus, J. (2025, November 26). What Is Ordinal Data? | Examples & Definition. Quillbot. Retrieved January 31, 2026, from https://quillbot.com/blog/research/ordinal-data/


