
What Is Interval Data? | Definition, Examples & Analysis
Interval data is a type of numerical data where the difference between each value is always equal. For example, the difference between 10 and 20 is the same as the difference between 50 and 60.
Unlike ratio data, interval data does not have a true zero. A value of zero does not mean that something is completely absent; it is simply another point on the scale.
Common examples of interval data include temperature measured in Celsius or Fahrenheit, standardized test scores, and psychological assessments.
Levels of measurement
Interval data is one of the four commonly recognized levels of measurement used in statistics:
- Nominal data: Categories without any order (e.g., eye color).
- Ordinal data: Categories with a meaningful order but unequal spacing (e.g., satisfaction ratings).
- Interval data: Numeric values with equal intervals but no true zero.
- Ratio data: Numeric values with equal intervals and an absolute zero.
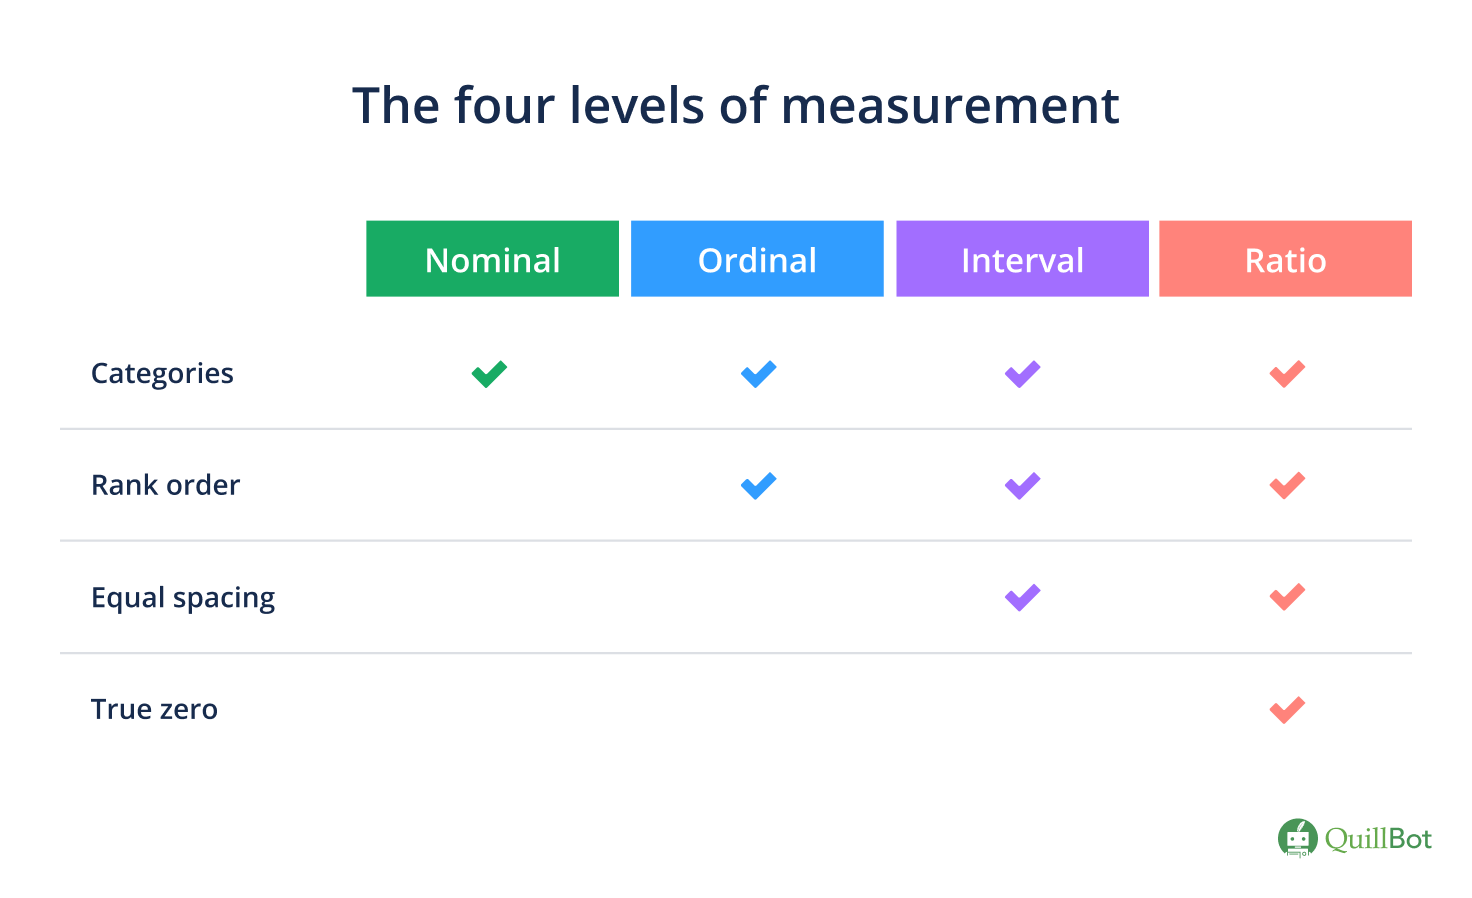
Nominal and ordinal variables are considered categorical, whereas interval and ratio variables are quantitative. Since interval data is quantitative, it supports a much broader range of statistical analyses.
Interval scale vs ratio scale
At first glance, interval and ratio scales appear very similar because both use equal distances between values. The key distinction is the presence of a true zero.
With an interval scale, zero does not represent the complete absence of the measured variable. As a result, multiplication and division are not meaningful.
For example, temperatures measured in Celsius or Fahrenheit increase by one-degree intervals, meaning the difference between 15°C and 16°C is identical to the difference between 30°C and 31°C. However, saying that 30°C is twice as hot as 15°C is incorrect because zero degrees is not the lowest possible temperature.
By contrast, the Kelvin temperature scale is a ratio scale. Since 0 Kelvin represents the complete absence of thermal energy, statements such as “20 K is twice as warm as 10 K” are mathematically meaningful.
Examples of interval data
Many standardized measurements use interval scales for their variables because they maintain equal spacing between scores without having a true zero.
| Type | Examples |
|---|---|
| Standardized tests | SAT
IQ GMAT GRE |
| Psychological assessments | Big Five personality trait tests
Beck’s Depression Inventory Raven’s Progressive Matrices |
How to identify interval data
A simple way to distinguish interval data from ordinal data is to ask two questions:
- Are the differences between consecutive values always equal?
- Does the scale lack a true zero?
If the answer to both questions is “yes,” you’re working with interval data.
- IQ scores are often treated as interval data because the difference between an IQ score of 90 and 100 is considered the same as the difference between 120 and 130. However, an IQ of 0 does not represent a complete absence of intelligence.
- Customer satisfaction ratings such as Poor, Fair, Good, and Excellent are ordinal because the categories are ranked, but the difference between them cannot be measured precisely.
Correctly identifying interval data allows researchers to use more advanced statistical techniques than would be appropriate for ordinal data.
Analyzing interval data
Once interval data has been collected, analysis usually starts with descriptive statistics that summarize the dataset.
Common descriptive statistics include:
- Frequency distributions
- Mean
- Median
- Mode
- Range
- Standard deviation
- Variance
Together, these statistics describe both the center and the spread of the data.
Because these scores are measured on an interval scale, you can use descriptive statistics to summarize the data and identify patterns.
Distribution
Tables and graphs can be used to organize your data and visualize its distribution.
| Anxiety score | Frequency |
|---|---|
| 0 – 10 | 5 |
| 11 – 20 | 12 |
| 21 – 30 | 18 |
| 31 – 40 | 10 |
| 41 – 50 | 5 |
Central tendency
When the data follows an approximately normal distribution, the mode, median, and mean can be used to describe the center of the dataset.
(n+1)/2 = (50+1)/2 = 25.5
In this example, there are 50 observations, so the median is the average of the 25th and 26th scores. If the 25th score is 24 and the 26th score is 25, the median is 24.5.
- Total score = 1,250
- Number of participants = 50
To find the mean, use the formula of ⅀x/n. Sum up all values (⅀x) and divide the sum by n.
- ⅀x = 1,250
- n = 50
- ⅀x/n = 1,250/50 = 25 (the mean)
Because the mean uses every value in the dataset, it is often the preferred measure of central tendency for normally distributed interval data.
Variability
Describing the spread of interval data is just as important as identifying its center. The standard deviation and variance are more complex to compute than the range, but they’re also more informative.
Range = 49 – 3 = 46
Standard deviation = 9.2
Variance = (9.2)² = 84.64
Statistical tests
Because interval data is quantitative, it can be analyzed using a wide variety of statistical techniques. If the data is approximately normally distributed and other assumptions are met, parametric tests are generally preferred because they provide greater statistical power.
Some of the most frequently used analyses to test hypotheses include:
| Goal | Samples or variables | Test | Example |
|---|---|---|---|
| Comparison of means | 2 samples | t-test | What is the difference in the average happiness scores of elderly residents from 2 different nursing homes? |
| Comparison of means | 3 or more samples | ANOVA | What is the difference in happiness scores of elderly residents from 3 fitness programs? |
| Correlation | 2 variables | Pearson’s r | How are fitness scores and happiness scores related? |
| Regression | 2 variables | Simple linear regression | What is the effect of fitness scores on happiness scores? |
Frequently asked questions about interval data
- Is interval data continuous?
-
Interval data is usually considered continuous data because it can take on a wide range of numerical values, including decimals. The values are measured on a scale where the distance between each point is meaningful and consistent.
For example, temperature measured in Celsius is interval data and can take values such as 20°C, 20.5°C, or 20.75°C. Each value represents a meaningful point on the scale.
However, not all interval data is continuous. Some interval variables are recorded as whole numbers only. For example, standardized test scores are measured on an interval scale but are often reported as discrete values because only certain scores are possible.
In short, interval data describes the measurement scale, while continuous data describes how values can occur. Many types of interval data are continuous, but the two terms are not interchangeable.
- What is the difference between interval and ratio data?
-
Ratio data has all the properties of interval data, but it also has a true zero. Zero means that the measured quantity is completely absent.
For example:
Temperature (interval)
- The difference between 10°C and 20°C is the same as the difference between 20°C and 30°C.
- A temperature of 0°C doesn’t mean there is no temperature (no true zero).
- You can’t say that 20°C is twice as hot as 10°C because there is no true zero.
Weight (ratio)
- The difference between 10 kg and 20 kg is the same as the difference between 20 kg and 30 kg.
- A weight of 0 kg means there is no weight.
- Therefore, 20 kg is twice as heavy as 10 kg.
- What is the difference between ordinal and interval data?
-
Ordinal data and interval data are similar because they can both be ranked in a logical order. However, for interval data, the differences between adjacent scores are equal.
Other interesting articles
If you want to know more about colors, letters, or the meaning of emojis, make sure to check out some of our other articles with explanations and examples.