Concept Map | What It Is and How to Build One
A concept map is a visual diagram of information. Concept maps organize, structure, and connect information by showing the relationships between different ideas, terms, or data points.
Learn more about what a concept map is and how to make one of your own in this guide, which also offers examples and templates to help you get started. Quillbot’s AI Chat can also help you organize information to streamline the creation of your concept map.
Key takeaways
- A concept map is a visual tool that helps you organize information and understand how different ideas, concepts, and details relate to one another.
- Learn about the different types of concept maps, including spider maps, hierarchical maps, network maps, and flowcharts, and how they differ from mind maps.
- Follow five simple steps to create your own concept map, from choosing a main concept to connecting related ideas with linking labels and cross-links.
- Explore examples of concept maps across subjects like biology, history, literature, and business to see how you can use them to organize complex information and support learning.
What is a concept map?
A concept map visually shows the connections between different concepts, facts, pieces of data, or other types of information. Some common types of concept maps are spider maps, hierarchical maps, system maps, and flowcharts. Some people also consider Venn diagrams, timelines, and graphic organizers to be types of concept maps, although others may disagree about this.
Concept mapping was developed in the 1970s by Joseph Novak, a professor of education at Cornell University, to encourage meaningful learning among students instead of rote memorization. Concept maps help students study smarter, not harder because instead of just recalling information as they learned it, they can understand the big picture, compare and contrast contrast, and connect new information to what they already know.
For example, a computer programmer may use a concept map to plan software architecture before building it, or an instructional designer may create a concept map to organize course content and show how learning objectives relate to one another before creating course content.
Concept map vs mind map
Both a concept map and a mind map can help students study, but they have a few key differences when it comes to form and function, as outlined in the table below.
| Feature | Concept map | Mind map |
|---|---|---|
| Primary focus | Connect multiple concepts | Develop one central topic or idea |
| Structure | Free-form (may be hierarchical, network-based, comparative, etc.) | Tree or radial (one single concept with branches for subtopics) |
| Connection lines | Clearly labeled with connections (e.g., “causes” or “input”) | Usually not labeled |
| Primary use case | Understanding how different concepts or elements relate, interact, and/or affect one another | Brainstorming or practicing active recall while studying |
For example, if you’re studying climate change, a mind map would put climate change at the center, with branches for related topics like causes, effects, solutions, and examples. A concept map, on the other hand, could connect several concepts, such as greenhouse gases, global warming, fossil fuels, and deforestation, using labeled lines to explain their relationships (e.g., “fossil fuels release greenhouse gases” and “greenhouse gases contribute to global warming”).
Components of a concept map
Before you try to make your own concept map, you may want to review the components that typically appear in them:
- Nodes: Represent concepts and usually appear as circles, ovals, or boxes. They represent core concepts, ideas, names, objects, or events. Nodes are often labeled using a single noun or noun phrase, but this isn’t always the case.
- Linking labels: Words and phrases that connect nodes. They use verbs, primarily action verbs, to define the exact relationship between nodes (e.g., “requires,” “produces,” and “belongs to”). They’re usually written alongside a line that connects the relevant nodes.
- Cross-links: Connect concepts in different areas of the map. They can show how knowledge from one branch of the map relates to knowledge from another or connect ideas across domains. Cross-links can reveal interdisciplinary relationships and unexpected insights.
- Propositions: Propositions do not appear visually on a concept map. Instead, they are statements you can make when connecting the ideas in a concept map. For example, a map may have nodes that read “humans” and “oxygen” connected by the linker “need.” The proposition would therefore be “humans need oxygen.”
How to make a concept map
If you aren’t sure how to make a concept map, follow these steps to learn how it’s done.
1. Identify the main concept
Before mapping anything, identify the core concept you want to explore. It might be a problem, question, or study topic. Your central concept should be complex enough to warrant mapping but not so broad you don’t know where to start.
2. Choose a creation method
Once you’ve defined your concept, choose how you’ll create your map. You may want to use paper and pens, dedicated concept map software, or a digital design tool. You can use Quillbot to help you create concept maps in presentation format, which you can then share with classmates or download to print.
3. Choose an organizational format
Next, choose a format that makes sense for your concept. A few common concept map formats are:
- Spider: Central concept in the middle with branches for sub-concepts and details
- Hierarchical: Broad concepts at the top and specific details at the bottom
- Network: Ideas interconnect in a web
- Flowchart: Processes or sequences in linear order, often with branches for variables
- Cause-and-effect: Shows how one concept affects another and implications
- Venn diagram: Overlapping circles show how concepts compare and contrast
4. Map out related concepts and details
Plot your core concepts, sub-concepts, and supporting details using nodes. Depending on the format you chose, you may start with the core concepts in the center, at the top, or at the left-hand side of your map. Consider using different shapes or colors to represent different types of nodes.
5. Add connecting lines, linking labels, and cross-links
After you map out your nodes with concepts and details, add lines to connect them. For each line, add a linking label that explains the relationship between the nodes the line connects. Your linking labels should be as specific as possible. For example, if you’re creating a concept map about climate change, you might connect “burning fossil fuels” to “greenhouse gas emissions” with the linking label “increases.”
Once you’ve done that, analyze your concept map and see if you can add cross-links. For instance, in your climate change concept map, you could add a cross-link between greenhouse gas emissions and rising global temperatures to show how two different branches of your map are related.
Concept map examples
Concept mapping works best for subjects that are rich in interconnected concepts, hierarchies, and cause-and-effect relationships. Review this table to understand how concept maps are used in different subjects, and then check out the specific examples of the maps themselves.
| Subject | Concept map example | What it shows |
|---|---|---|
| Biology | Human digestive system | How organs such as the mouth, stomach, small intestine, and large intestine work together to break down food and absorb nutrients |
| History | Causes of World War I | How political alliances, militarism, nationalism, imperialism, and key events contributed to the war |
| Geography | Factors influencing urbanization | How population growth, employment opportunities, infrastructure, migration, and housing availability contribute to the growth of cities |
| Literature | Character relationships in One Hundred Years of Solitude by Gabriel García Marquez | How members of the Buendía family are connected through family ties, relationships, conflicts, and recurring patterns across generations |
| Computer science | How a search engine works | How web crawlers, indexing, algorithms, and ranking systems work together to find and display relevant search results |
| Political science | Branches of government | How the legislative, executive, and judicial branches interact and share or limit power |
| Philosophy | Connections between ethical frameworks | How different ethical approaches, such as utilitarianism, deontology, and virtue ethics, overlap, differ, and relate to moral decision-making |
| Psychology | Theories of human motivation | How intrinsic motivation, extrinsic motivation, needs, rewards, and behavior are related |
| Business | Marketing strategy | How target audiences, market research, branding, content, and promotional channels contribute to a marketing plan |
| Economics | Supply and demand | How prices, consumer demand, production, and market equilibrium influence one another |
| Engineering | Electrical circuit components | How power sources, resistors, capacitors, switches, and other components work together in a circuit |
| Environmental science | The water cycle | How evaporation, condensation, precipitation, and collection are connected |
Spider map example
A high school history student decides to make a spider map showing the causes of World War I. Since all the branches are related to the causes of the war, the student leaves out linking labels.

Flowchart example
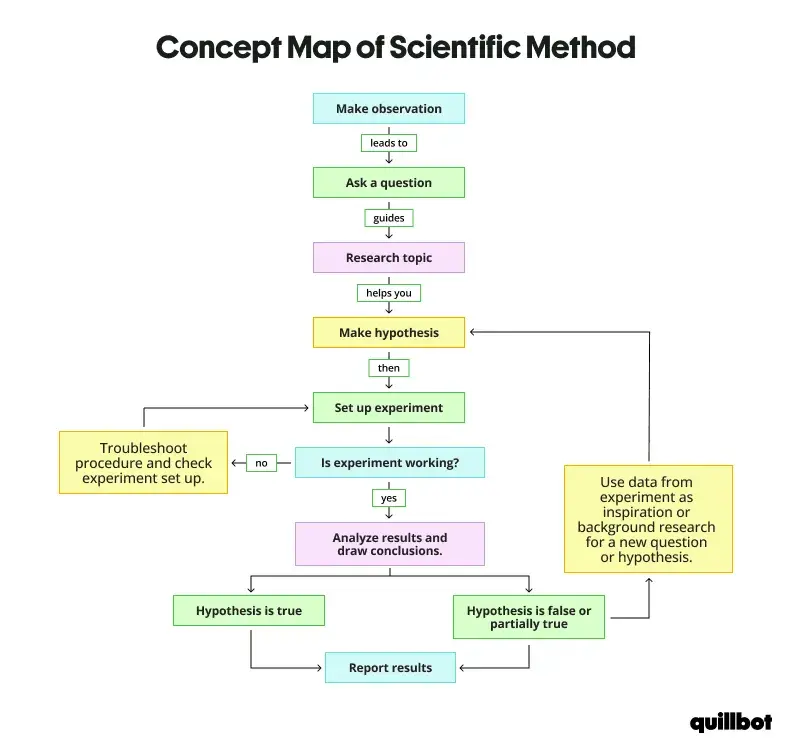
A middle school science class is learning about the scientific method. Together with their teacher, they make a flowchart concept map on the board to understand the steps of the process and the relevant variables.
Hierarchical example
A university student who wants to be a veterinarian is studying biology. They have to review the classification of living things and create a concept map to help them. The student adds a cross-link between the Protist, Fungi, Plantae, and Animalia Kingdoms to remind themself that organisms from these Kingdoms have cells with nuclei.

Network example
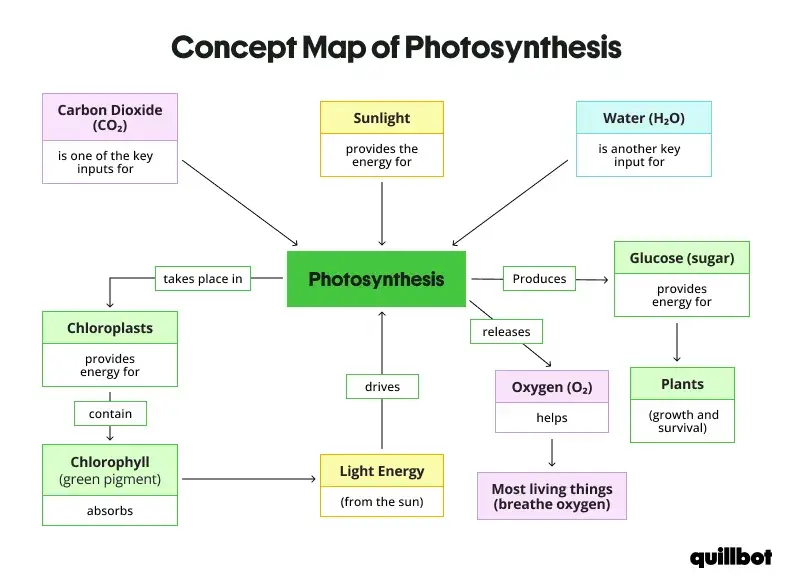
A novice gardener taking a botany class creates this photosynthesis concept map to show the process as a network, with linking labels showing the relationships between nodes.
Frequently asked questions about concept maps
- What does a concept map look like?
-
A concept map looks like a network of connected nodes, lines, and words that visually show how concepts and ideas relate to one another.
Unlike a mind map, a concept map isn’t limited to a tree or radial structure. It can look like a flowchart, Venn diagram, hierarchy, or more.
Quillbot’s Summarizer can help you condense lengthy information and identify key concepts, making it easier to organize ideas and create a clear, meaningful concept map.
Other interesting articles
If you want to know more about colors, letters, or the meaning of emojis, make sure to check out some of our other articles with explanations and examples.Cite this Quillbot article
We encourage the use of reliable sources in all types of writing. You can copy and paste the citation or click the "Cite this article" button to automatically add it to our free Citation Generator.
Santoro, K. (2026, November 10). Concept Map | What It Is and How to Build One. Quillbot. Retrieved November 13, 2026, from https://quillbot.com/blog/education/concept-map/